Key Insights & Trends
COVID-19 Hospitalizations Key Insights: August 12, - August 18, 2022
https://drive.google.com/file/d/1SwKthsMgAEgNIsxd1OvdlrVzoBj-5HNW/view?usp=sharing
COVID-19 Hospitalizations Key Insights: August 05, - August 11, 2022
https://drive.google.com/file/d/123srkMpqIZvelVyo-PyWCdpEP3hLvHQ6/view?usp=sharing
COVID-19 Hospitalizations Key Insights: July 29, - August 04, 2022
https://drive.google.com/file/d/1MomkfLEOc6-yP_Ib6eVActBEtLbZ85tg/view?usp=sharing
COVID-19 Hospitalizations Key Insights: July 22, - July 28, 2022
https://drive.google.com/file/d/1VfgIkNKjm3L4WFSHP_jyAyV-gwz__Uwp/view?usp=sharing
COVID-19 Hospitalizations Key Insights: July 15 - July 21, 2022
https://drive.google.com/file/d/1BL_QGIhQvbmk4HQRMPPEG8hU8qX0KGpH/view?usp=sharing
COVID-19 Hospitalizations Key Insights: July 08 - July 14, 2022
https://drive.google.com/file/d/1rGg9_HGCLowcYBhmJHaMolhzcfXoO2Xs/view?usp=sharing
COVID-19 Hospitalizations Key Insights: July 01 - July 07, 2022
https://drive.google.com/file/d/1-M3PcDCAEwGnjJhOvunHIhArzoAUkA_d/view?usp=sharing
COVID-19 Hospitalizations Key Insights: June 24 - June 30, 2022
https://drive.google.com/file/d/11EBAkemhFTtFxArt5EevEhOjRJOJsiy1/view?usp=sharing
COVID-19 Hospitalizations Key Insights: June 10 - June 16, 2022
https://drive.google.com/file/d/1hZoVeSW7H4FDk9AhkLODuGswOKdisfdb/view?usp=sharing
COVID-19 Hospitalizations Key Insights: June 03 - June 09, 2022
https://drive.google.com/file/d/1s_WFt1ZZkpuZBj3-5_a-Xl4RUl6h4W28/view?usp=sharing
COVID-19 Hospitalizations Key Insights: May 27 - June 02, 2022
https://drive.google.com/file/d/1qiTLZWXnsEbfL3dBOezd7FAc83WCm3Lw/view?usp=sharing
COVID-19 Hospitalizations Key Insights: May 20 - May 26, 2022
https://drive.google.com/file/d/1RxlGsMSEFUBzS9E1gU4_egXk0MFK4r7J/view?usp=sharing
COVID-19 Hospitalizations Key Insights: May 13 - May 19, 2022
https://drive.google.com/file/d/1xAN6-IRAViz7wF4lymtwTR_tkTMzWNQf/view?usp=sharing
COVID-19 Hospitalizations Key Insights: May 06 - May 12, 2022
https://drive.google.com/file/d/14n8zbRoL5dLqoV9FpN90pAqkNG63Ylyt/view?usp=sharing
COVID-19 Hospitalizations Key Insights: April 29 - May 05, 2022
https://drive.google.com/file/d/1LV2W7mHjC6ih3l7gdPYyi6VRahT8LpBJ/view?usp=sharing
COVID-19 Hospitalizations Key Insights: April 22 - April 28, 2022
https://drive.google.com/file/d/16WG2wRRe3UzsYjPHCSmxGXS_oXWX9xY_/view?usp=sharing
COVID-19 Hospitalizations Key Insights: April 15 - April 21, 2022
https://drive.google.com/file/d/1TfZNkhKYeqq3N6qIvFcuLoRASg1O5_Hw/view?usp=sharing
COVID-19 Hospitalizations Key Insights: April 08 - April 14, 2022
https://drive.google.com/file/d/1dIPw1vnJdALZEmwXirv6V_ltxZX0bJpA/view?usp=sharing
COVID-19 Hospitalizations Key Insights: April 01 - April 07, 2022
https://drive.google.com/file/d/1ZIRJq0V3Xo5kFtxuN3Ni5gCABoGFEr4E/view?usp=sharing
COVID-19 Hospitalizations Key Insights: March 25 - March 31, 2022
https://drive.google.com/file/d/1em5T5ctxNNj1xeOqENw2HVxbzo68vh1x/view?usp=sharing
COVID-19 Hospitalizations Key Insights: March 18 - March 24, 2022
https://drive.google.com/file/d/19q_Y3fhibVFCIlyTDo1kiCQo8b6DNBFL/view?usp=sharing
COVID-19 Hospitalizations Key Insights: March 11 - March 17, 2022
https://drive.google.com/file/d/1B_NrH2g87TRyogSsePDTw7nIuBwBfVWn/view?usp=sharing
COVID-19 Hospitalizations Key Insights: March 04 - March 10, 2022
https://drive.google.com/file/d/1LDggrIwt-DDKMWqkgGGSFPPLOOIMYOzb/view?usp=sharing
COVID-19 Hospitalizations Key Insights: February 25 - March 03, 2022
https://drive.google.com/file/d/1CszvNF-7dJNPjvNh2rAegkJAjQgY_tYa/view?usp=sharing
COVID-19 Hospitalizations Key Insights: February 18 - February 24, 2022
https://drive.google.com/file/d/1S40bw9HZ6S67KPw3blJvXqVxfSBPqgEl/view?usp=sharing
COVID-19 Hospitalizations Key Insights: February 11 - February 17, 2022
https://drive.google.com/file/d/1oKtEl7L3x4VbwGGF8p7w2VGBws3K538Q/view?usp=sharing
COVID-19 Hospitalizations Key Insights: February 04 - February 10, 2022
https://drive.google.com/file/d/1bIAKkKS-x55m1SyKTXyiDKkdxFwYF4P4/view?usp=sharing
COVID-19 Hospitalizations Key Insights: January 28 - February 03, 2022
https://drive.google.com/file/d/1EOxcrtkmw75Cy7zZn6xhVO2hKATX7_Eh/view?usp=sharing
COVID-19 Hospitalizations Key Insights: January 21 - January 27, 2022
https://drive.google.com/file/d/1UI-w3E9rGRauRGKmy5KHGtrnazFG87Of/view?usp=sharing
COVID-19 Hospitalizations Key Insights: January 14 - January 20, 2022
https://drive.google.com/file/d/1fUFrsIH1MLoYVA0QvvyntQOjTzNdkHE-/view?usp=sharing
COVID-19 Hospitalizations Key Insights: January 07 - January 13, 2022
https://drive.google.com/file/d/1n-D6WdLoE7TH34n_jXmCF46bsxH9U8MZ/view?usp=sharing
COVID-19 Hospitalizations Key Insights: December 31 - January 06, 2022
https://drive.google.com/file/d/1xgAMvYcDgEwgn1JUfkGy5OBaRfi6O8ZR/view?usp=sharing
COVID-19 Hospitalizations Key Insights: December 24 - December 30, 2021
https://drive.google.com/file/d/1wNGGH3r3OJ01fnfgGOvXRV-KocNzcO88/view?usp=sharing
COVID-19 Hospitalizations Key Insights: December 17 - December 23, 2021
https://drive.google.com/file/d/18K6UhC32W8tXs9lOaZtMjG-2EhewkLDs/view?usp=sharing
COVID-19 Hospitalizations Key Insights: December 10 - December 16, 2021
https://drive.google.com/file/d/1PRh4fxrodnF8Q8hYD8trU3EQjGt5Dndq/view?usp=sharing
COVID-19 Hospitalizations Key Insights: December 03 - December 09, 2021
https://drive.google.com/file/d/13GeQQnVRSy54gUPT_4r0VsbdasnFmwZJ/view?usp=sharing
COVID-19 Hospitalizations Key Insights: November 26 - December 02, 2021
https://drive.google.com/file/d/1vNRGMtqN-bEPp9LnXVYSgkqWjXudDtFg/view?usp=sharing
COVID-19 Hospitalizations Key Insights: November 19 - November 25, 2021
https://drive.google.com/file/d/1G5SFAFyh08_-7aZrFvyBR_urFIiiF8Xr/view?usp=sharing
COVID-19 Hospitalizations Key Insights: November 12 - November 18, 2021
https://drive.google.com/file/d/1efGffoE95dIMCKmgWMUAIO6hntj8z3b7/view?usp=sharing
COVID-19 Hospitalizations Key Insights: November 05 - November 11, 2021
https://drive.google.com/file/d/1tB0Lk9YUBIyFPNUYdsSuhJKm4sqfLCc2/view?usp=sharing
COVID-19 Hospitalizations Key Insights: October 29 - November 04, 2021
https://drive.google.com/file/d/1rQ0vof-KvLK5Nash7X2FuLdF3IW1sKKW/view?usp=sharing
COVID-19 Hospitalizations Key Insights: October 22 - October 28, 2021
https://drive.google.com/file/d/1yF1RrpToC5d9k5pdDz04IwKH7Qfw6Ku8/view?usp=sharing
COVID-19 Hospitalizations Key Insights: October 15 - October 21, 2021
https://drive.google.com/file/d/1BaLFL7Zn_lP3O2bXyg_SMwQG-EEjgIyB/view?usp=sharing
COVID-19 Hospitalizations Key Insights: October 08 - October 14, 2021
https://drive.google.com/file/d/1PiQ0zX2uElZP8YHiY8PyM0t1YGtX5dAa/view?usp=sharing
COVID-19 Hospitalizations Key Insights: October 01 - October 07, 2021
https://drive.google.com/file/d/1rMxNlc17GzWaYO5G8ie8MMo5yXcPmbYj/view?usp=sharing
COVID-19 Hospitalizations Key Insights: September 24 - September 30, 2021
https://drive.google.com/file/d/1VC2rgBLczgN20UaXyES8lre_6vaS3XtF/view?usp=sharing
COVID-19 Hospitalizations Key Insights: September 17 - September 23, 2021
https://drive.google.com/file/d/1tgeYqVPcBpwyQWAHjKaLT6JLZ3ofZeBq/view?usp=sharing
COVID-19 Hospitalizations Key Insights: September 10 - September 16, 2021
https://drive.google.com/file/d/1wRt6md2ESJzOcMle6ytEVqvkKW6dkS9T/view?usp=sharing
COVID-19 Hospitalizations Key Insights: September 03 - September 09, 2021
https://drive.google.com/file/d/1m32IDxdyU-04V7NiPoKaNGNxRQZHcyBv/view?usp=sharing
COVID-19 Hospitalizations Key Insights: August 27 - September 02, 2021
https://drive.google.com/file/d/1CCrvj1Dxfu6XLhYTcvPI4I_ML0WDvjvG/view?usp=sharing
COVID-19 Hospitalizations Key Insights: August 20 - August 26, 2021
https://drive.google.com/file/d/1-SZND2usDjdjuftabdvVEbJytbkOzuqz/view?usp=sharing
COVID-19 Hospitalizations Key Insights: August 13 - August 19, 2021
https://drive.google.com/file/d/1kDyubtlkfLJaw_wPbizJlbhf2LB4lD18/view?usp=sharing
COVID-19 Hospitalizations Key Insights: August 06 - August 12, 2021
https://drive.google.com/file/d/1VQNyzUJqKVUo4WrxnrjCgzo71Krk_Oq3/view?usp=sharing
COVID-19 Hospitalizations Key Insights: July 30 - August 05, 2021
https://drive.google.com/file/d/1Q_13aflMNlIOpEPQGT85W-kyxkdbdMlB/view?usp=sharing
COVID-19 Hospitalizations Key Insights: July 23 - July 29, 2021
https://drive.google.com/file/d/1iRMYtbA9xM356paClf02qVd4PF_an4rK/view?usp=sharing
COVID-19 Hospitalizations Key Insights: July 16 - July 22, 2021
https://drive.google.com/file/d/1rCYUiykAkXe-MVV6qhqpkLoPFnF0a4Ne/view?usp=sharing
COVID-19 Hospitalizations Key Insights: July 09 - July 15, 2021
https://drive.google.com/file/d/14C0JQuhKH7S_v09EUr9JbQVcgcc1RpPw/view?usp=sharing
COVID-19 Hospitalizations Key Insights: July 02 - July 08, 2021
https://drive.google.com/file/d/1u1dJ4SXHKLxUvpBnfVn4RtxcEsSUHLFk/view?usp=sharing
COVID-19 Hospitalizations Key Insights: June 25 - July 01, 2021
https://drive.google.com/file/d/1ZebdSPUusz_rUpLiJP7gGn0dcVxerXpf/view?usp=sharing
COVID-19 Hospitalizations Key Insights: June 18 - June 24, 2021
https://drive.google.com/file/d/1wqfPkfrcomOF9QhcNdVZcAeJFJ0i38dX/view?usp=sharing
COVID-19 Hospitalizations Key Insights: June 10 - June 17, 2021
https://drive.google.com/file/d/1aBxblEZBOMhgnhCNQgLAYTtZDzrdun5Z/view?usp=sharing
COVID-19 Hospitalizations Key Insights: June 4 - June 10, 2021
https://drive.google.com/file/d/1MgGTd7XCJQs9_XiamGU3Iv1HWbz2htVl/view?usp=sharing
COVID-19 Hospitalizations Key Insights: May 28 - June 3, 2021
https://drive.google.com/file/d/1aC49zo2PGAX6VtVSsVhf0QVcCzm1sKUL/view?usp=sharing
COVID-19 Hospitalizations Key Insights: May 21 - May 27, 2021
https://drive.google.com/file/d/1ZLW7ozZzs91_DdQqg6VcuQFk-pqeaM8A/view?usp=sharing
COVID-19 Hospitalizations Key Insights: May 14 - May 20, 2021
https://drive.google.com/file/d/1Pl-iCO0_tCpZgfbF1GllATpxd1j9-ggj/view?usp=sharing
COVID-19 Hospitalizations Key Insights: May 07 - May 13, 2021
https://drive.google.com/file/d/1XCUQvxaOs4fwHPoNSRR1_5ey9GoWjHL9/view?usp=sharing
COVID-19 Hospitalizations Key Insights: April 30 - May 06, 2021
https://drive.google.com/file/d/1p88SelXdVvfVOsoZefKH2YsQvDIj20lA/view?usp=sharing
COVID-19 Hospitalizations Key Insights: April 23 - April 29, 2021
https://drive.google.com/file/d/1N01oOG8H5eCa4c6Vsknsa_9r16a6S_O1/view?usp=sharing
COVID-19 Hospitalizations Key Insights: April 16 - April 22, 2021
https://drive.google.com/file/d/10wBi5z4V0jftfZgC-1NyuqdajE9PMg4S/view?usp=sharing
COVID-19 Hospitalizations Key Insights: April 9 - April 15, 2021
https://drive.google.com/file/d/1Qc0uzjdoxgcBYiE4YzZJoigvH8QqQvQM/view?usp=sharing
COVID-19 Hospitalizations Key Insights: April 2 - April 8, 2021
https://drive.google.com/file/d/1i4iQL6CjT7ydnS3UCp8kB_uBzd_NVNP1/view?usp=sharing
COVID-19 Hospitalizations Key Insights: March 26 - April 1, 2021
https://drive.google.com/file/d/1oejblV6NEBOkufAm1Jhb5mrKEoYZjcKJ/view?usp=sharing
COVID-19 Hospitalizations Key Insights: March 19 - March 25, 2021
https://drive.google.com/file/d/1akT9075WYOk2BzXTFnyOGL1XuaTlQOGp/view?usp=sharing
COVID-19 Hospitalizations Key Insights: March 12 - March 18, 2021
https://drive.google.com/file/d/1ctsuOouItV0Jb2u1_OEZeON_AN0k5-I4/view?usp=sharing
COVID-19 Hospitalizations Key Insights: March 5 - March 11, 2021
https://drive.google.com/file/d/1UD65Iu6iblfdapichfIuVrbXbTwyEhnh/view?usp=sharing
COVID-19 Hospitalizations Key Insights: February 26 - March 4, 2021
https://drive.google.com/file/d/13wVGoiDJLTNklpbnXSgKSDnHyMobRc2D/view?usp=sharing
COVID-19 Hospitalizations Key Insights: February 19 - February 25, 2021
https://drive.google.com/file/d/1jzJh7vYFlhsp2-OiJU-vi5z9L-OSAsmo/view?usp=sharing
COVID-19 Hospitalizations Key Insights: February 12 - February 18, 2021
https://drive.google.com/file/d/1U9tOvzk0dy-isgIcRJtGNzQj9l6wu0Nt/view?usp=sharing
COVID-19 Hospitalizations Key Insights: February 5 - February 11, 2021
https://drive.google.com/file/d/1UuHf0h3jKlWJar-Gx1cUinMqDG8Nskb-/view?usp=sharing
COVID-19 Hospitalizations Key Insights: January 29 - February 4, 2021
https://drive.google.com/file/d/1-YZIbdoEYyQPI4x4Sed4Udr5W-BTZJe4/view?usp=sharing
COVID-19 Hospitalizations Key Insights: January 22 - 28, 2021
https://drive.google.com/file/d/1LrUNqiyy66TMyW6vsOnJXBI9-DwsYx_i/view?usp=sharing
COVID-19 Hospitalizations Key Insights: January 15 - 21, 2021
https://drive.google.com/file/d/1KdkJSYeJYix2VLfRY_E09wOHQcudhsXE/view?usp=sharing
COVID-19 Hospitalizations Key Insights: January 8 - 14, 2021
https://drive.google.com/file/d/1X7rpxTiwre4WHbiCdFidaCjAKO_vU0ZH/view?usp=sharing
COVID-19 Hospitalizations Key Insights: January 1 - 7, 2021
https://drive.google.com/file/d/1_ofjVytcnn_FzJBmLXgCsl67Xg0Vcwt3/view?usp=sharing
COVID-19 Hospitalizations Key Insights: December 25 - 31, 2020
https://drive.google.com/file/d/1RH_wCkJd5S1wgUXp5-2jItPzh25uLgYh/view?usp=sharing
COVID-19 Hospitalizations Key Insights: December 11 - 17, 2020
https://drive.google.com/file/d/1YeN7-yGKE2Qpep3AeVVRNHUG1AmJLzM4/view?usp=sharing
COVID-19 Hospitalizations Key Insights: December 4 - 10, 2020
https://drive.google.com/file/d/1HOfOr42s_71LH6n37EZJvxgk0DbbYlH2/view?usp=sharing
COVID-19 Hospitalizations Key Insights: November 27 - December 3, 2020
https://drive.google.com/file/d/1rdps4078uK3IjlNCiKopeC8lEw6lDOvw/view?usp=sharing
COVID-19 Hospitalizations Key Insights: November 20 - 26, 2020
https://drive.google.com/file/d/1lvbX7tqkY_1gmrgNIxzrPX2QBbD1nrfD/view?usp=sharing
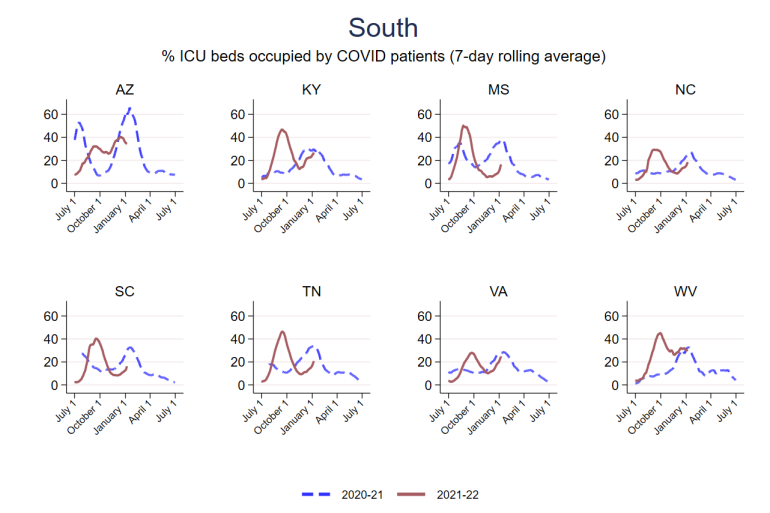
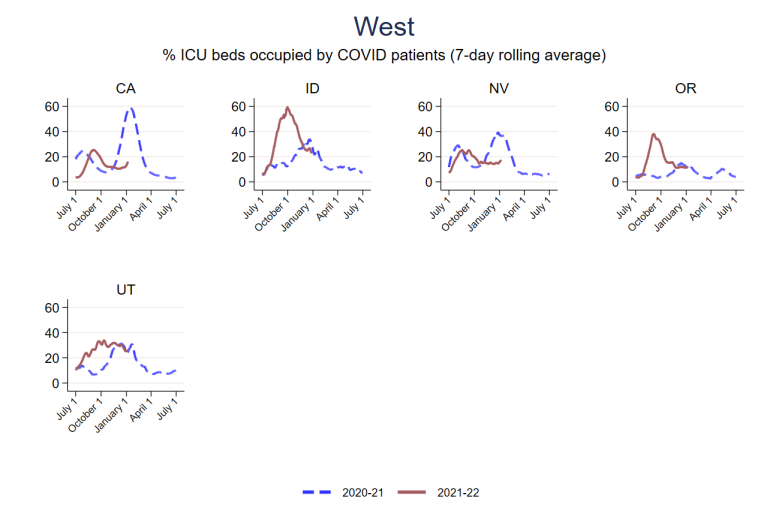
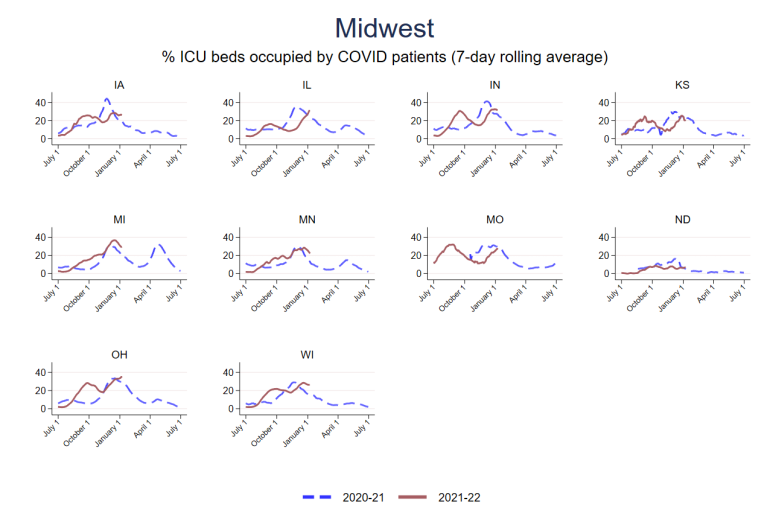
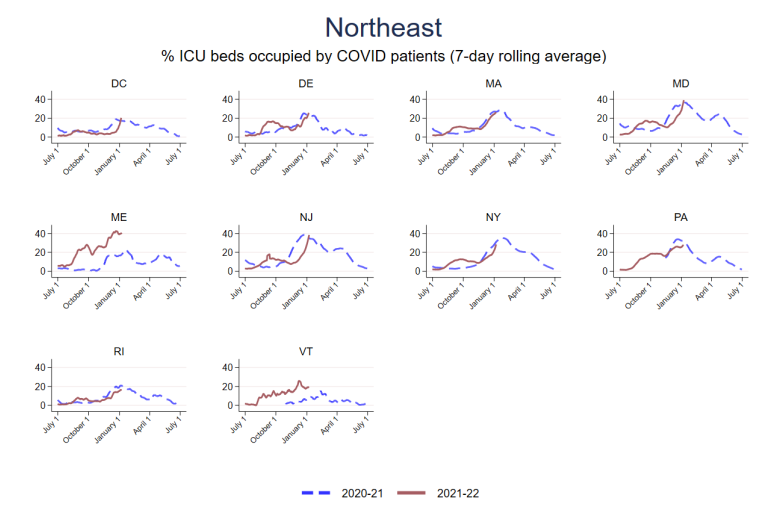
Percent ICU Beds Occupied by COVID-19 Patients
January 08, 2022
https://drive.google.com/file/d/1xwcfJgqhpY_WyxTaSgoh1aEklxth4bI5/view?usp=sharing
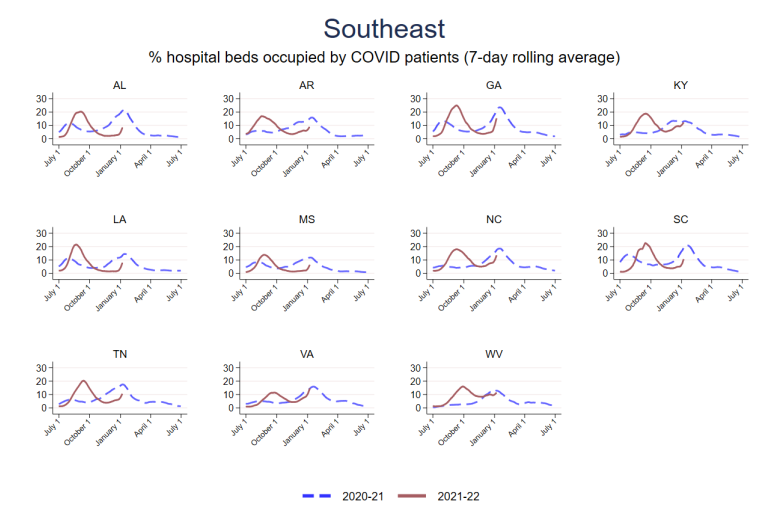
Percent Hospital Beds Occupied by COVID-19 Patients
January 08, 2022
https://drive.google.com/file/d/1ylnjLSZf8Sv0iagjBXrU9xldSvfFO_My/view?usp=sharing
Percent ICU Beds Occupied by COVID-19 Patients
December 08, 2021
https://drive.google.com/file/d/1m1CNQwkzCc1p4z452ZF56UMVb8TBrptm/view?usp=sharing
Percent Hospital Beds Occupied by COVID-19 Patients
December 08, 2021
https://drive.google.com/file/d/1E4gReJ6NbmLDIOiGVWQ83Qi6ewAz-vls/view?usp=sharing
Percent ICU Beds Occupied by COVID-19 Patients
January 24, 2021
https://drive.google.com/file/d/1sOMJwEiZGZF9uh6DOqCM4kChrp3o4g23/view?usp=sharing
Percent Hospital Beds Occupied by COVID-19 Patients
January 24, 2021
https://drive.google.com/file/d/1urRCtB6OyMV_OF1rP5EqeVyf2KXk4WGj/view?usp=sharing
Percent ICU Beds Occupied by COVID-19 Patients
December 22, 2020
https://drive.google.com/file/d/1aVXxRQpTje8tmKcj-ITggYLpl2A9ex_8/view?usp=sharing
Percent Hospital Beds Occupied by COVID-19 Patients
December 22, 2020
https://drive.google.com/file/d/1UkbKcaIldrXCa8JEYFLmrymbHKyRgBUz/view?usp=sharing
COVID-19 ICU Hospitalizations per Capita by U.S. Region
December 22, 2020
https://drive.google.com/file/d/1mxmM-5xl6rpTN_AEr5poMqhkd9uL6-o7/view?usp=sharing
COVID-19 Hospitalizations per Capita by U.S. Region
December 22, 2020
https://drive.google.com/file/d/1kfO93tJ2BBswUNTREcTjIZrT2lH_HLxp/view?usp=sharing
Percent ICU Beds Occupied by COVID-19 Patients
November 30, 2020
https://drive.google.com/file/d/1mhJNHMwGndVwKv0fu6lsg_cmiJ1NAR8R/view?usp=sharing
Percent Hospital Beds Occupied by COVID-19 Patients
November 30, 2020
https://drive.google.com/file/d/1eGiSuGR4jtwVvLIJeiiYyKTGbkBiIERR/view?usp=sharing
Percent ICU Beds Occupied by COVID-19 Patients
November 16, 2020
https://drive.google.com/file/d/18J5Tulbw6SFYlMKxRZknWZmzT4Yr82Hs/view?usp=sharing
Percent Hospital Beds Occupied by COVID-19 Patients
November 16, 2020
https://drive.google.com/file/d/1CN3_PWSvyTl1p92XsSZcsd1v_LsiONq8/view?usp=sharing
COVID-19 ICU Hospitalizations per Capita by U.S. Region
November 16, 2020
https://drive.google.com/file/d/1NDQWELuQhS24dXDSFqLLEBxHTZJ5N4gg/view?usp=sharing
COVID-19 Hospitalizations per Capita by U.S. Region
November 16, 2020
https://drive.google.com/file/d/1xzPjAcmHxmyIwF1stNhMVg3nTC4DeBBV/view?usp=sharing
COVID-19 ICU Hospitalizations per Capita by U.S. Region
November 3, 2020
https://drive.google.com/file/d/1nKnItZ-u-58_Flik2oWAkICJusF0564u/view?usp=sharing
COVID-19 Hospitalizations per Capita by U.S. Region
November 3, 2020
https://drive.google.com/file/d/1_WxEKqGlbhxtpvAhpdPpA0UQP0gWPZLY/view?usp=sharing
Average Daily Change of COVID-19 Hospitalizations by U.S. Region
November 3, 2020
https://drive.google.com/file/d/1PRpXf8ksUtPm_Uq5omYDURYh0YpqKQjt/view?usp=sharing
COVID-19 ICU Hospitalizations per Capita by U.S. Region
October 21, 2020
https://drive.google.com/file/d/1LxzzmJY0ga1H0TOdnpBUMG6xKga4mZT7/view?usp=sharing
COVID-19 Hospitalizations per Capita by U.S. Region
October 21, 2020
https://drive.google.com/file/d/1TZVkHUd7EUyz_NLaYzY91IXgfssAhrui/view?usp=sharing
COVID-19 ICU Hospitalizations per Capita by U.S. Region
October 1, 2020
https://drive.google.com/file/d/16yjvYGKIN9QdyViwNosgUTlX8lKphtW_/view?usp=sharing
Average Daily Change of COVID-19 Hospitalizations by U.S. Region
October 1, 2020
https://drive.google.com/file/d/1W239yfj-JPvcY9RwWKxvsE5IVnjtgOsV/view?usp=sharing
Average Daily Change of COVID-19 Hospitalizations by U.S. Region
September 14, 2020
https://drive.google.com/file/d/10UroyoOpk4sX_2HJTI7kqNHyTx5ht1Gy/view?usp=sharing
COVID-19 ICU Hospitalizations per Capita by U.S. Region
September 14, 2020
https://drive.google.com/file/d/15n2bjvEvvYrnMbA2-cmyMRJMZCPXU-Ke/view?usp=sharing
COVID-19 ICU Hospitalizations per Capita by U.S. Region
August 15, 2020
https://drive.google.com/file/d/1DchP1P7hGBT-_uB2Oz6VFASaFSyobUAc/view?usp=sharing
COVID-19 Hospitalizations per Capita by U.S. Region
August 15, 2020
https://drive.google.com/file/d/1SjXcJxjSdtJ8-8gp5pSn46qKx3D4NKou/view?usp=sharing
COVID-19 Hospitalizations per Capita by U.S. Region
July 18, 2020
https://drive.google.com/file/d/1ZT6OHzh-Jy4j1ng3IEru9jkgEJaJrCEn/view?usp=sharing
COVID-19 Hospitalizations per Capita by U.S. Region
July 10, 2020
https://drive.google.com/file/d/1chJ2uf6ZpwVw69sX54LoxkhNtuUb4k1v/view
COVID-19 Hospitalizations Key Insights: August 12, - August 18, 2022
https://drive.google.com/file/d/1SwKthsMgAEgNIsxd1OvdlrVzoBj-5HNW/view?usp=sharing
COVID-19 Hospitalizations Key Insights: August 05, - August 11, 2022
https://drive.google.com/file/d/123srkMpqIZvelVyo-PyWCdpEP3hLvHQ6/view?usp=sharing
COVID-19 Hospitalizations Key Insights: July 29, - August 04, 2022
https://drive.google.com/file/d/1MomkfLEOc6-yP_Ib6eVActBEtLbZ85tg/view?usp=sharing
COVID-19 Hospitalizations Key Insights: July 22, - July 28, 2022
https://drive.google.com/file/d/1VfgIkNKjm3L4WFSHP_jyAyV-gwz__Uwp/view?usp=sharing
COVID-19 Hospitalizations Key Insights: July 15 - July 21, 2022
https://drive.google.com/file/d/1BL_QGIhQvbmk4HQRMPPEG8hU8qX0KGpH/view?usp=sharing
COVID-19 Hospitalizations Key Insights: July 08 - July 14, 2022
https://drive.google.com/file/d/1rGg9_HGCLowcYBhmJHaMolhzcfXoO2Xs/view?usp=sharing
COVID-19 Hospitalizations Key Insights: July 01 - July 07, 2022
https://drive.google.com/file/d/1-M3PcDCAEwGnjJhOvunHIhArzoAUkA_d/view?usp=sharing
COVID-19 Hospitalizations Key Insights: June 24 - June 30, 2022
https://drive.google.com/file/d/11EBAkemhFTtFxArt5EevEhOjRJOJsiy1/view?usp=sharing
COVID-19 Hospitalizations Key Insights: June 10 - June 16, 2022
https://drive.google.com/file/d/1hZoVeSW7H4FDk9AhkLODuGswOKdisfdb/view?usp=sharing
COVID-19 Hospitalizations Key Insights: June 03 - June 09, 2022
https://drive.google.com/file/d/1s_WFt1ZZkpuZBj3-5_a-Xl4RUl6h4W28/view?usp=sharing
COVID-19 Hospitalizations Key Insights: May 27 - June 02, 2022
https://drive.google.com/file/d/1qiTLZWXnsEbfL3dBOezd7FAc83WCm3Lw/view?usp=sharing
COVID-19 Hospitalizations Key Insights: May 20 - May 26, 2022
https://drive.google.com/file/d/1RxlGsMSEFUBzS9E1gU4_egXk0MFK4r7J/view?usp=sharing
COVID-19 Hospitalizations Key Insights: May 13 - May 19, 2022
https://drive.google.com/file/d/1xAN6-IRAViz7wF4lymtwTR_tkTMzWNQf/view?usp=sharing
COVID-19 Hospitalizations Key Insights: May 06 - May 12, 2022
https://drive.google.com/file/d/14n8zbRoL5dLqoV9FpN90pAqkNG63Ylyt/view?usp=sharing
COVID-19 Hospitalizations Key Insights: April 29 - May 05, 2022
https://drive.google.com/file/d/1LV2W7mHjC6ih3l7gdPYyi6VRahT8LpBJ/view?usp=sharing
COVID-19 Hospitalizations Key Insights: April 22 - April 28, 2022
https://drive.google.com/file/d/16WG2wRRe3UzsYjPHCSmxGXS_oXWX9xY_/view?usp=sharing
COVID-19 Hospitalizations Key Insights: April 15 - April 21, 2022
https://drive.google.com/file/d/1TfZNkhKYeqq3N6qIvFcuLoRASg1O5_Hw/view?usp=sharing
COVID-19 Hospitalizations Key Insights: April 08 - April 14, 2022
https://drive.google.com/file/d/1dIPw1vnJdALZEmwXirv6V_ltxZX0bJpA/view?usp=sharing
COVID-19 Hospitalizations Key Insights: April 01 - April 07, 2022
https://drive.google.com/file/d/1ZIRJq0V3Xo5kFtxuN3Ni5gCABoGFEr4E/view?usp=sharing
COVID-19 Hospitalizations Key Insights: March 25 - March 31, 2022
https://drive.google.com/file/d/1em5T5ctxNNj1xeOqENw2HVxbzo68vh1x/view?usp=sharing
COVID-19 Hospitalizations Key Insights: March 18 - March 24, 2022
https://drive.google.com/file/d/19q_Y3fhibVFCIlyTDo1kiCQo8b6DNBFL/view?usp=sharing
COVID-19 Hospitalizations Key Insights: March 11 - March 17, 2022
https://drive.google.com/file/d/1B_NrH2g87TRyogSsePDTw7nIuBwBfVWn/view?usp=sharing
COVID-19 Hospitalizations Key Insights: March 04 - March 10, 2022
https://drive.google.com/file/d/1LDggrIwt-DDKMWqkgGGSFPPLOOIMYOzb/view?usp=sharing
COVID-19 Hospitalizations Key Insights: February 25 - March 03, 2022
https://drive.google.com/file/d/1CszvNF-7dJNPjvNh2rAegkJAjQgY_tYa/view?usp=sharing
COVID-19 Hospitalizations Key Insights: February 18 - February 24, 2022
https://drive.google.com/file/d/1S40bw9HZ6S67KPw3blJvXqVxfSBPqgEl/view?usp=sharing
COVID-19 Hospitalizations Key Insights: February 11 - February 17, 2022
https://drive.google.com/file/d/1oKtEl7L3x4VbwGGF8p7w2VGBws3K538Q/view?usp=sharing
COVID-19 Hospitalizations Key Insights: February 04 - February 10, 2022
https://drive.google.com/file/d/1bIAKkKS-x55m1SyKTXyiDKkdxFwYF4P4/view?usp=sharing
COVID-19 Hospitalizations Key Insights: January 28 - February 03, 2022
https://drive.google.com/file/d/1EOxcrtkmw75Cy7zZn6xhVO2hKATX7_Eh/view?usp=sharing
COVID-19 Hospitalizations Key Insights: January 21 - January 27, 2022
https://drive.google.com/file/d/1UI-w3E9rGRauRGKmy5KHGtrnazFG87Of/view?usp=sharing
COVID-19 Hospitalizations Key Insights: January 14 - January 20, 2022
https://drive.google.com/file/d/1fUFrsIH1MLoYVA0QvvyntQOjTzNdkHE-/view?usp=sharing
COVID-19 Hospitalizations Key Insights: January 07 - January 13, 2022
https://drive.google.com/file/d/1n-D6WdLoE7TH34n_jXmCF46bsxH9U8MZ/view?usp=sharing
COVID-19 Hospitalizations Key Insights: December 31 - January 06, 2022
https://drive.google.com/file/d/1xgAMvYcDgEwgn1JUfkGy5OBaRfi6O8ZR/view?usp=sharing
COVID-19 Hospitalizations Key Insights: December 24 - December 30, 2021
https://drive.google.com/file/d/1wNGGH3r3OJ01fnfgGOvXRV-KocNzcO88/view?usp=sharing
COVID-19 Hospitalizations Key Insights: December 17 - December 23, 2021
https://drive.google.com/file/d/18K6UhC32W8tXs9lOaZtMjG-2EhewkLDs/view?usp=sharing
COVID-19 Hospitalizations Key Insights: December 10 - December 16, 2021
https://drive.google.com/file/d/1PRh4fxrodnF8Q8hYD8trU3EQjGt5Dndq/view?usp=sharing
COVID-19 Hospitalizations Key Insights: December 03 - December 09, 2021
https://drive.google.com/file/d/13GeQQnVRSy54gUPT_4r0VsbdasnFmwZJ/view?usp=sharing
COVID-19 Hospitalizations Key Insights: November 26 - December 02, 2021
https://drive.google.com/file/d/1vNRGMtqN-bEPp9LnXVYSgkqWjXudDtFg/view?usp=sharing
COVID-19 Hospitalizations Key Insights: November 19 - November 25, 2021
https://drive.google.com/file/d/1G5SFAFyh08_-7aZrFvyBR_urFIiiF8Xr/view?usp=sharing
COVID-19 Hospitalizations Key Insights: November 12 - November 18, 2021
https://drive.google.com/file/d/1efGffoE95dIMCKmgWMUAIO6hntj8z3b7/view?usp=sharing
COVID-19 Hospitalizations Key Insights: November 05 - November 11, 2021
https://drive.google.com/file/d/1tB0Lk9YUBIyFPNUYdsSuhJKm4sqfLCc2/view?usp=sharing
COVID-19 Hospitalizations Key Insights: October 29 - November 04, 2021
https://drive.google.com/file/d/1rQ0vof-KvLK5Nash7X2FuLdF3IW1sKKW/view?usp=sharing
COVID-19 Hospitalizations Key Insights: October 22 - October 28, 2021
https://drive.google.com/file/d/1yF1RrpToC5d9k5pdDz04IwKH7Qfw6Ku8/view?usp=sharing
COVID-19 Hospitalizations Key Insights: October 15 - October 21, 2021
https://drive.google.com/file/d/1BaLFL7Zn_lP3O2bXyg_SMwQG-EEjgIyB/view?usp=sharing
COVID-19 Hospitalizations Key Insights: October 08 - October 14, 2021
https://drive.google.com/file/d/1PiQ0zX2uElZP8YHiY8PyM0t1YGtX5dAa/view?usp=sharing
COVID-19 Hospitalizations Key Insights: October 01 - October 07, 2021
https://drive.google.com/file/d/1rMxNlc17GzWaYO5G8ie8MMo5yXcPmbYj/view?usp=sharing
COVID-19 Hospitalizations Key Insights: September 24 - September 30, 2021
https://drive.google.com/file/d/1VC2rgBLczgN20UaXyES8lre_6vaS3XtF/view?usp=sharing
COVID-19 Hospitalizations Key Insights: September 17 - September 23, 2021
https://drive.google.com/file/d/1tgeYqVPcBpwyQWAHjKaLT6JLZ3ofZeBq/view?usp=sharing
COVID-19 Hospitalizations Key Insights: September 10 - September 16, 2021
https://drive.google.com/file/d/1wRt6md2ESJzOcMle6ytEVqvkKW6dkS9T/view?usp=sharing
COVID-19 Hospitalizations Key Insights: September 03 - September 09, 2021
https://drive.google.com/file/d/1m32IDxdyU-04V7NiPoKaNGNxRQZHcyBv/view?usp=sharing
COVID-19 Hospitalizations Key Insights: August 27 - September 02, 2021
https://drive.google.com/file/d/1CCrvj1Dxfu6XLhYTcvPI4I_ML0WDvjvG/view?usp=sharing
COVID-19 Hospitalizations Key Insights: August 20 - August 26, 2021
https://drive.google.com/file/d/1-SZND2usDjdjuftabdvVEbJytbkOzuqz/view?usp=sharing
COVID-19 Hospitalizations Key Insights: August 13 - August 19, 2021
https://drive.google.com/file/d/1kDyubtlkfLJaw_wPbizJlbhf2LB4lD18/view?usp=sharing
COVID-19 Hospitalizations Key Insights: August 06 - August 12, 2021
https://drive.google.com/file/d/1VQNyzUJqKVUo4WrxnrjCgzo71Krk_Oq3/view?usp=sharing
COVID-19 Hospitalizations Key Insights: July 30 - August 05, 2021
https://drive.google.com/file/d/1Q_13aflMNlIOpEPQGT85W-kyxkdbdMlB/view?usp=sharing
COVID-19 Hospitalizations Key Insights: July 23 - July 29, 2021
https://drive.google.com/file/d/1iRMYtbA9xM356paClf02qVd4PF_an4rK/view?usp=sharing
COVID-19 Hospitalizations Key Insights: July 16 - July 22, 2021
https://drive.google.com/file/d/1rCYUiykAkXe-MVV6qhqpkLoPFnF0a4Ne/view?usp=sharing
COVID-19 Hospitalizations Key Insights: July 09 - July 15, 2021
https://drive.google.com/file/d/14C0JQuhKH7S_v09EUr9JbQVcgcc1RpPw/view?usp=sharing
COVID-19 Hospitalizations Key Insights: July 02 - July 08, 2021
https://drive.google.com/file/d/1u1dJ4SXHKLxUvpBnfVn4RtxcEsSUHLFk/view?usp=sharing
COVID-19 Hospitalizations Key Insights: June 25 - July 01, 2021
https://drive.google.com/file/d/1ZebdSPUusz_rUpLiJP7gGn0dcVxerXpf/view?usp=sharing
COVID-19 Hospitalizations Key Insights: June 18 - June 24, 2021
https://drive.google.com/file/d/1wqfPkfrcomOF9QhcNdVZcAeJFJ0i38dX/view?usp=sharing
COVID-19 Hospitalizations Key Insights: June 10 - June 17, 2021
https://drive.google.com/file/d/1aBxblEZBOMhgnhCNQgLAYTtZDzrdun5Z/view?usp=sharing
COVID-19 Hospitalizations Key Insights: June 4 - June 10, 2021
https://drive.google.com/file/d/1MgGTd7XCJQs9_XiamGU3Iv1HWbz2htVl/view?usp=sharing
COVID-19 Hospitalizations Key Insights: May 28 - June 3, 2021
https://drive.google.com/file/d/1aC49zo2PGAX6VtVSsVhf0QVcCzm1sKUL/view?usp=sharing
COVID-19 Hospitalizations Key Insights: May 21 - May 27, 2021
https://drive.google.com/file/d/1ZLW7ozZzs91_DdQqg6VcuQFk-pqeaM8A/view?usp=sharing
COVID-19 Hospitalizations Key Insights: May 14 - May 20, 2021
https://drive.google.com/file/d/1Pl-iCO0_tCpZgfbF1GllATpxd1j9-ggj/view?usp=sharing
COVID-19 Hospitalizations Key Insights: May 07 - May 13, 2021
https://drive.google.com/file/d/1XCUQvxaOs4fwHPoNSRR1_5ey9GoWjHL9/view?usp=sharing
COVID-19 Hospitalizations Key Insights: April 30 - May 06, 2021
https://drive.google.com/file/d/1p88SelXdVvfVOsoZefKH2YsQvDIj20lA/view?usp=sharing
COVID-19 Hospitalizations Key Insights: April 23 - April 29, 2021
https://drive.google.com/file/d/1N01oOG8H5eCa4c6Vsknsa_9r16a6S_O1/view?usp=sharing
COVID-19 Hospitalizations Key Insights: April 16 - April 22, 2021
https://drive.google.com/file/d/10wBi5z4V0jftfZgC-1NyuqdajE9PMg4S/view?usp=sharing
COVID-19 Hospitalizations Key Insights: April 9 - April 15, 2021
https://drive.google.com/file/d/1Qc0uzjdoxgcBYiE4YzZJoigvH8QqQvQM/view?usp=sharing
COVID-19 Hospitalizations Key Insights: April 2 - April 8, 2021
https://drive.google.com/file/d/1i4iQL6CjT7ydnS3UCp8kB_uBzd_NVNP1/view?usp=sharing
COVID-19 Hospitalizations Key Insights: March 26 - April 1, 2021
https://drive.google.com/file/d/1oejblV6NEBOkufAm1Jhb5mrKEoYZjcKJ/view?usp=sharing
COVID-19 Hospitalizations Key Insights: March 19 - March 25, 2021
https://drive.google.com/file/d/1akT9075WYOk2BzXTFnyOGL1XuaTlQOGp/view?usp=sharing
COVID-19 Hospitalizations Key Insights: March 12 - March 18, 2021
https://drive.google.com/file/d/1ctsuOouItV0Jb2u1_OEZeON_AN0k5-I4/view?usp=sharing
COVID-19 Hospitalizations Key Insights: March 5 - March 11, 2021
https://drive.google.com/file/d/1UD65Iu6iblfdapichfIuVrbXbTwyEhnh/view?usp=sharing
COVID-19 Hospitalizations Key Insights: February 26 - March 4, 2021
https://drive.google.com/file/d/13wVGoiDJLTNklpbnXSgKSDnHyMobRc2D/view?usp=sharing
COVID-19 Hospitalizations Key Insights: February 19 - February 25, 2021
https://drive.google.com/file/d/1jzJh7vYFlhsp2-OiJU-vi5z9L-OSAsmo/view?usp=sharing
COVID-19 Hospitalizations Key Insights: February 12 - February 18, 2021
https://drive.google.com/file/d/1U9tOvzk0dy-isgIcRJtGNzQj9l6wu0Nt/view?usp=sharing
COVID-19 Hospitalizations Key Insights: February 5 - February 11, 2021
https://drive.google.com/file/d/1UuHf0h3jKlWJar-Gx1cUinMqDG8Nskb-/view?usp=sharing
COVID-19 Hospitalizations Key Insights: January 29 - February 4, 2021
https://drive.google.com/file/d/1-YZIbdoEYyQPI4x4Sed4Udr5W-BTZJe4/view?usp=sharing
COVID-19 Hospitalizations Key Insights: January 22 - 28, 2021
https://drive.google.com/file/d/1LrUNqiyy66TMyW6vsOnJXBI9-DwsYx_i/view?usp=sharing
COVID-19 Hospitalizations Key Insights: January 15 - 21, 2021
https://drive.google.com/file/d/1KdkJSYeJYix2VLfRY_E09wOHQcudhsXE/view?usp=sharing
COVID-19 Hospitalizations Key Insights: January 8 - 14, 2021
https://drive.google.com/file/d/1X7rpxTiwre4WHbiCdFidaCjAKO_vU0ZH/view?usp=sharing
COVID-19 Hospitalizations Key Insights: January 1 - 7, 2021
https://drive.google.com/file/d/1_ofjVytcnn_FzJBmLXgCsl67Xg0Vcwt3/view?usp=sharing
COVID-19 Hospitalizations Key Insights: December 25 - 31, 2020
https://drive.google.com/file/d/1RH_wCkJd5S1wgUXp5-2jItPzh25uLgYh/view?usp=sharing
COVID-19 Hospitalizations Key Insights: December 11 - 17, 2020
https://drive.google.com/file/d/1YeN7-yGKE2Qpep3AeVVRNHUG1AmJLzM4/view?usp=sharing
COVID-19 Hospitalizations Key Insights: December 4 - 10, 2020
https://drive.google.com/file/d/1HOfOr42s_71LH6n37EZJvxgk0DbbYlH2/view?usp=sharing
COVID-19 Hospitalizations Key Insights: November 27 - December 3, 2020
https://drive.google.com/file/d/1rdps4078uK3IjlNCiKopeC8lEw6lDOvw/view?usp=sharing
COVID-19 Hospitalizations Key Insights: November 20 - 26, 2020
https://drive.google.com/file/d/1lvbX7tqkY_1gmrgNIxzrPX2QBbD1nrfD/view?usp=sharing
Percent ICU Beds Occupied by COVID-19 Patients
January 08, 2022
https://drive.google.com/file/d/1xwcfJgqhpY_WyxTaSgoh1aEklxth4bI5/view?usp=sharing
Percent Hospital Beds Occupied by COVID-19 Patients
January 08, 2022
https://drive.google.com/file/d/1ylnjLSZf8Sv0iagjBXrU9xldSvfFO_My/view?usp=sharing
Percent ICU Beds Occupied by COVID-19 Patients
December 08, 2021
https://drive.google.com/file/d/1m1CNQwkzCc1p4z452ZF56UMVb8TBrptm/view?usp=sharing
Percent Hospital Beds Occupied by COVID-19 Patients
December 08, 2021
https://drive.google.com/file/d/1E4gReJ6NbmLDIOiGVWQ83Qi6ewAz-vls/view?usp=sharing
Percent ICU Beds Occupied by COVID-19 Patients
January 24, 2021
https://drive.google.com/file/d/1sOMJwEiZGZF9uh6DOqCM4kChrp3o4g23/view?usp=sharing
Percent Hospital Beds Occupied by COVID-19 Patients
January 24, 2021
https://drive.google.com/file/d/1urRCtB6OyMV_OF1rP5EqeVyf2KXk4WGj/view?usp=sharing
Percent ICU Beds Occupied by COVID-19 Patients
December 22, 2020
https://drive.google.com/file/d/1aVXxRQpTje8tmKcj-ITggYLpl2A9ex_8/view?usp=sharing
Percent Hospital Beds Occupied by COVID-19 Patients
December 22, 2020
https://drive.google.com/file/d/1UkbKcaIldrXCa8JEYFLmrymbHKyRgBUz/view?usp=sharing
COVID-19 ICU Hospitalizations per Capita by U.S. Region
December 22, 2020
https://drive.google.com/file/d/1mxmM-5xl6rpTN_AEr5poMqhkd9uL6-o7/view?usp=sharing
COVID-19 Hospitalizations per Capita by U.S. Region
December 22, 2020
https://drive.google.com/file/d/1kfO93tJ2BBswUNTREcTjIZrT2lH_HLxp/view?usp=sharing
Percent ICU Beds Occupied by COVID-19 Patients
November 30, 2020
https://drive.google.com/file/d/1mhJNHMwGndVwKv0fu6lsg_cmiJ1NAR8R/view?usp=sharing
Percent Hospital Beds Occupied by COVID-19 Patients
November 30, 2020
https://drive.google.com/file/d/1eGiSuGR4jtwVvLIJeiiYyKTGbkBiIERR/view?usp=sharing
Percent ICU Beds Occupied by COVID-19 Patients
November 16, 2020
https://drive.google.com/file/d/18J5Tulbw6SFYlMKxRZknWZmzT4Yr82Hs/view?usp=sharing
Percent Hospital Beds Occupied by COVID-19 Patients
November 16, 2020
https://drive.google.com/file/d/1CN3_PWSvyTl1p92XsSZcsd1v_LsiONq8/view?usp=sharing
COVID-19 ICU Hospitalizations per Capita by U.S. Region
November 16, 2020
https://drive.google.com/file/d/1NDQWELuQhS24dXDSFqLLEBxHTZJ5N4gg/view?usp=sharing
COVID-19 Hospitalizations per Capita by U.S. Region
November 16, 2020
https://drive.google.com/file/d/1xzPjAcmHxmyIwF1stNhMVg3nTC4DeBBV/view?usp=sharing
COVID-19 ICU Hospitalizations per Capita by U.S. Region
November 3, 2020
https://drive.google.com/file/d/1nKnItZ-u-58_Flik2oWAkICJusF0564u/view?usp=sharing
COVID-19 Hospitalizations per Capita by U.S. Region
November 3, 2020
https://drive.google.com/file/d/1_WxEKqGlbhxtpvAhpdPpA0UQP0gWPZLY/view?usp=sharing
Average Daily Change of COVID-19 Hospitalizations by U.S. Region
November 3, 2020
https://drive.google.com/file/d/1PRpXf8ksUtPm_Uq5omYDURYh0YpqKQjt/view?usp=sharing
COVID-19 ICU Hospitalizations per Capita by U.S. Region
October 21, 2020
https://drive.google.com/file/d/1LxzzmJY0ga1H0TOdnpBUMG6xKga4mZT7/view?usp=sharing
COVID-19 Hospitalizations per Capita by U.S. Region
October 21, 2020
https://drive.google.com/file/d/1TZVkHUd7EUyz_NLaYzY91IXgfssAhrui/view?usp=sharing
COVID-19 ICU Hospitalizations per Capita by U.S. Region
October 1, 2020
https://drive.google.com/file/d/16yjvYGKIN9QdyViwNosgUTlX8lKphtW_/view?usp=sharing
Average Daily Change of COVID-19 Hospitalizations by U.S. Region
October 1, 2020
https://drive.google.com/file/d/1W239yfj-JPvcY9RwWKxvsE5IVnjtgOsV/view?usp=sharing
Average Daily Change of COVID-19 Hospitalizations by U.S. Region
September 14, 2020
https://drive.google.com/file/d/10UroyoOpk4sX_2HJTI7kqNHyTx5ht1Gy/view?usp=sharing
COVID-19 ICU Hospitalizations per Capita by U.S. Region
September 14, 2020
https://drive.google.com/file/d/15n2bjvEvvYrnMbA2-cmyMRJMZCPXU-Ke/view?usp=sharing
COVID-19 ICU Hospitalizations per Capita by U.S. Region
August 15, 2020
https://drive.google.com/file/d/1DchP1P7hGBT-_uB2Oz6VFASaFSyobUAc/view?usp=sharing
COVID-19 Hospitalizations per Capita by U.S. Region
August 15, 2020
https://drive.google.com/file/d/1SjXcJxjSdtJ8-8gp5pSn46qKx3D4NKou/view?usp=sharing
COVID-19 Hospitalizations per Capita by U.S. Region
July 18, 2020
https://drive.google.com/file/d/1ZT6OHzh-Jy4j1ng3IEru9jkgEJaJrCEn/view?usp=sharing
COVID-19 Hospitalizations per Capita by U.S. Region
July 10, 2020
https://drive.google.com/file/d/1chJ2uf6ZpwVw69sX54LoxkhNtuUb4k1v/view
COVID-19 Hospitalizations by U.S. Region
Percent of ICU Beds Occupied by COVID-19 Patients, as of January 08, 2022
Percent of Hospital Beds Occupied by COVID-19 Patients, as of January 08, 2022
Citation:
University of Minnesota COVID-19 Hospitalization Tracking Project, Carlson School of Management