Human Resources & Industrial Relations Employment Statistics
Graduate employment
of 2023 graduates received employment offers within six months after graduation
- 100% mean salary with U.S. work authorization
94% mean salary without U.S. work authorization
- $85,000 mean salary with U.S. work authorization
- $83,500 mean salary without U.S. work authorization
- $91,800 mean salary for women
- $85,000 mean salary for women
- $85,000 mean salary for students of color
$76,000 median salary for non-business undergraduate majors
*Based on usable salary information from 70% of graduates with accepted employment offers
Graduates

Graduates seeking full-time employment
| Industry | Percent | Median Salary |
|---|---|---|
| Manufacturing | 22% | $82,000 |
| Consumer Packaged Goods | 15% | $87,5001 |
| Consulting | 12%2 | $60,000 |
| Technology | 12% | N/A |
| Healthcare | 6% | N/A |
| Hospitality | 6% | N/A |
| Energy | 3% | N/A |
| Financial Services | 3% | N/A |
| Media/Entertainment | 3% | N/A |
| Non-Profit | 3% | N/A |
| Real Estate | 3% | N/A |
| Transportation & Logistics | 3% | N/A |
| Other Industries | 9% | N/A |
| Years of Experience | Percent | Median Salary |
|---|---|---|
| One year or less | 45% | $72,000 |
| 1–3 years | 40% | $85,500 |
| 3–5 years | 9% | $65,000 |
| 5 or more years | 6% | N/A |
2Up 10% year-to-year
Where Students Accepted Jobs
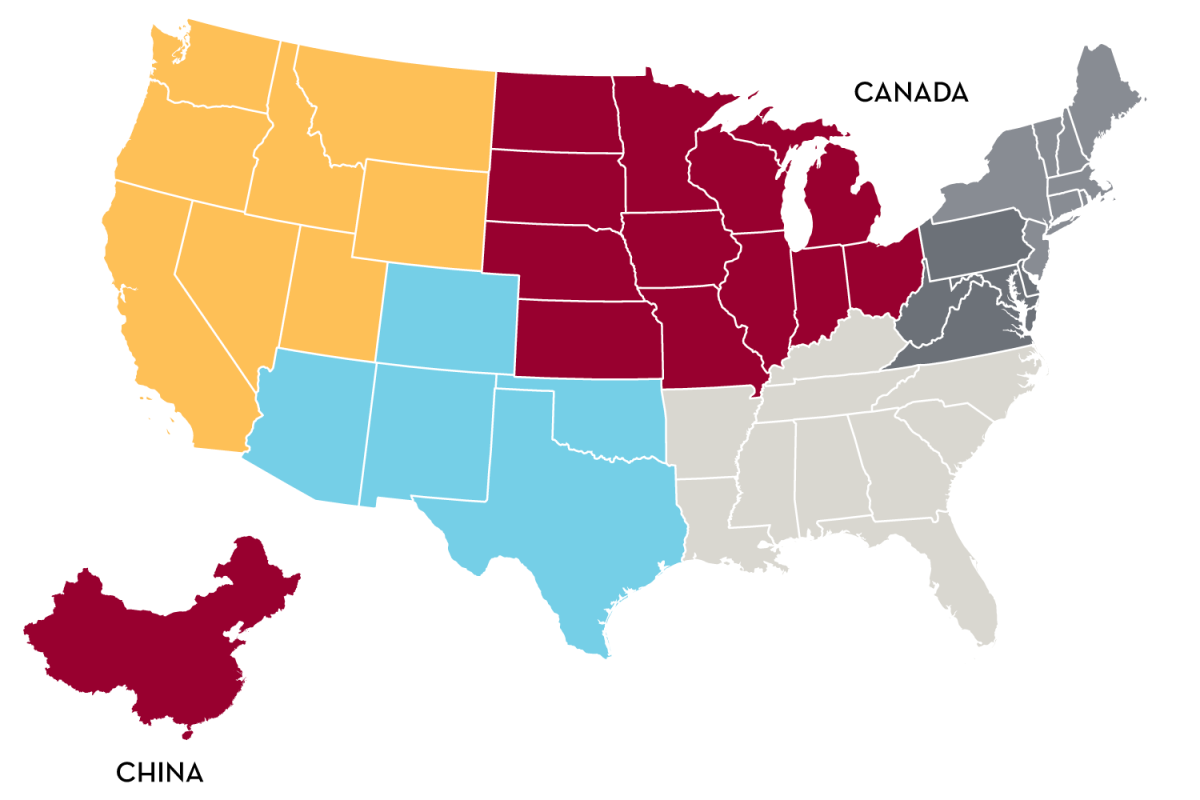
| Region | Percent |
|---|---|
| Midwest | 55% |
| West | 15% |
| Southeast | 9% |
| Southwest | 3% |
| China | 12% |
| Canada | 6% |
| Source | Percentage |
|---|---|
| Graduate-Initiated Job Search Activities | 46% |
| Unknown | 15% |
| School-Facilitated Recruiting Activities | 39% |
Accepted Internship Offers
accepted internship offers
$31.67 with US work authorization
Where students accepted internships
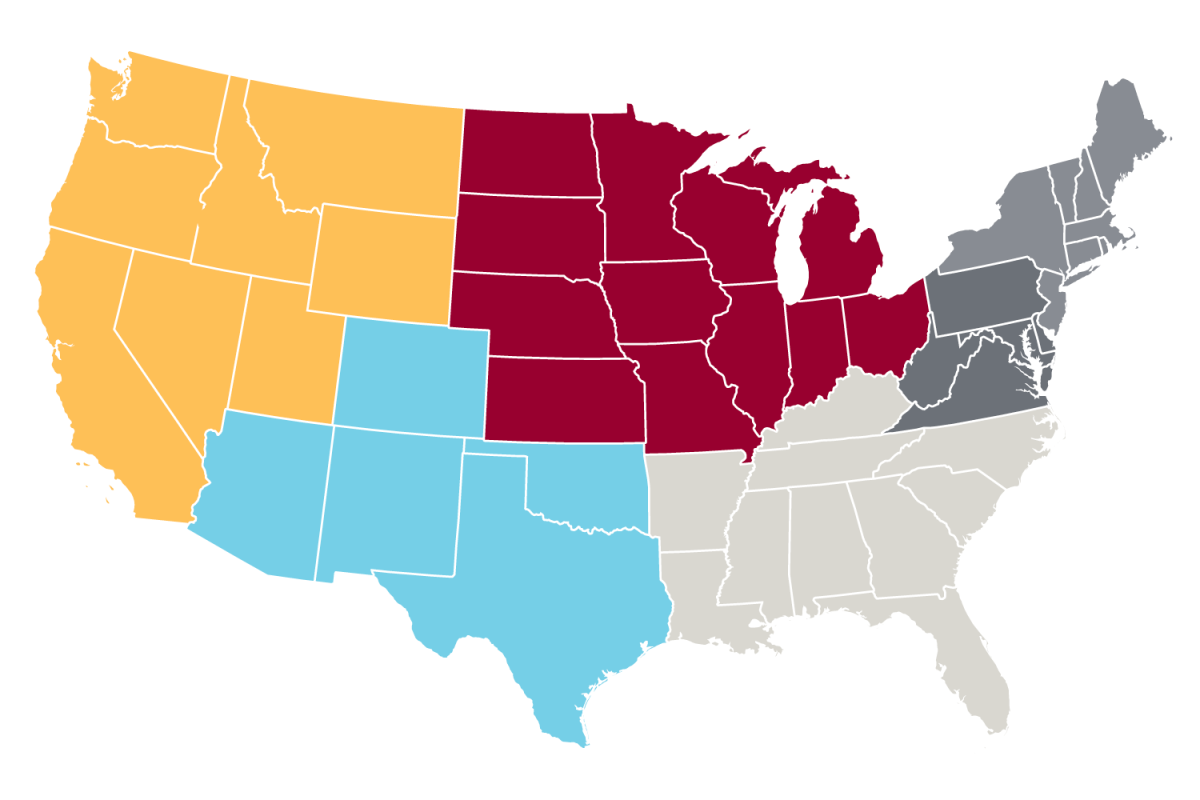
| Region | Percent |
|---|---|
| Midwest | 47% |
| West | 10% |
| Southeast | 10% |
| Southwest | 3% |
| Mid-Atlantic | 3% |
| New England | 13% |
| Unknown | 14% |
| By Industry | Percent | Median Hourly Rate |
|---|---|---|
| Manufacturing | 30% | $27.00 |
| Consumer Packaged Goods | 17% | $43.25 |
| Technology | 17% | $34.25 |
| Non-Profit | 10% | N/A |
| Healthcare | 7% | N/A |
| Consulting | 4% | N/A |
| Media & Entertainment | 3% | N/A |
| Energy | 3% | N/A |
| Financial Services | 3% | N/A |
| Government | 3% | N/A |
| Hospitality | 3% | N/A |
Companies that Hired Carlson MHRIR Students
- Akkodis
- Banner Engineering
- Boeing
- Bristol-Myers Squibb
- Causey & YE Law P.L.L.C
- Corning INC
- Creative Artist Agency
- Dell Technology
- Deloitte
- Delta Air Lines
- Fraser
- General Mills
Granite Partners
Honeywell International Inc
Illuminate USA
Intel Corporation
Land O' Lakes, Inc
Lawrence Kenshin LTD.
Lenovo
Marco Technologies LLC
Metropolitan Council
Minth North America
Miss Saigon
Monarch Collective
NVent
Ocbang
Parker Hannifin
PepsiCo
Polaris Industries
Raytheon Technologies
Rise Baking Company
Spaulding Group
Sungrow Power Supply
Swagelok
Tencent America
Turnberry Solutions
United Software Corporation
UnitedHealth Group
University of Minnesota
University of Wisconsin
US Bank
Wagner Spray Tech
WINIT Information Technology Co. LTD
Woodhill Country Club
Excel Energy
Bold companies were top hires in 2023
Human Resources Leadership Development Program
Human Resources Business Partners
Human Resources Generalist
Human Resources Specialist

“The Carlson Business Career Center does an outstanding job helping us throughout the recruiting process."
- MHRIR RECRUITING PARTNER
| Job function | Class of 2024 | Class of 2025 |
|---|---|---|
| International Students | 51% | 42% |
| Men | 26% | 37% |
| Women | 74% | 63% |
| Students of Color | 29% | 30% |
| Avg. Undergraduate GPA | 3.55 | 3.62 |
| Avg. Full-Time Work Experience | 1.8 Years | 2.5 Years |
Geographic Representation
| Location | Percent |
|---|---|
| Minnesota | 20% |
| Other U.S. | 29% |
| China | 29% |
| Other International | 22% |
| Location | Percent |
|---|---|
| Minnesota | 36% |
| Other U.S. | 21% |
| China | 15% |
| Other International | 27% |