Accountancy Employment Statistics
*Based on usable salary information from 56% of graduates with accepted employment offers
| Function | Percent |
|---|---|
| Accounting | 81% |
| Finance | 15% |
| Other | 4% |
| Function | Percent |
|---|---|
| Accounting Services | 37% |
| Financial Services | 26% |
| Consulting | 19% |
| Government | 4% |
| Hospitality | 4% |
| Non-Profit | 4% |
| Technology | 4% |
| Other (Incl. Construction) | 4% |
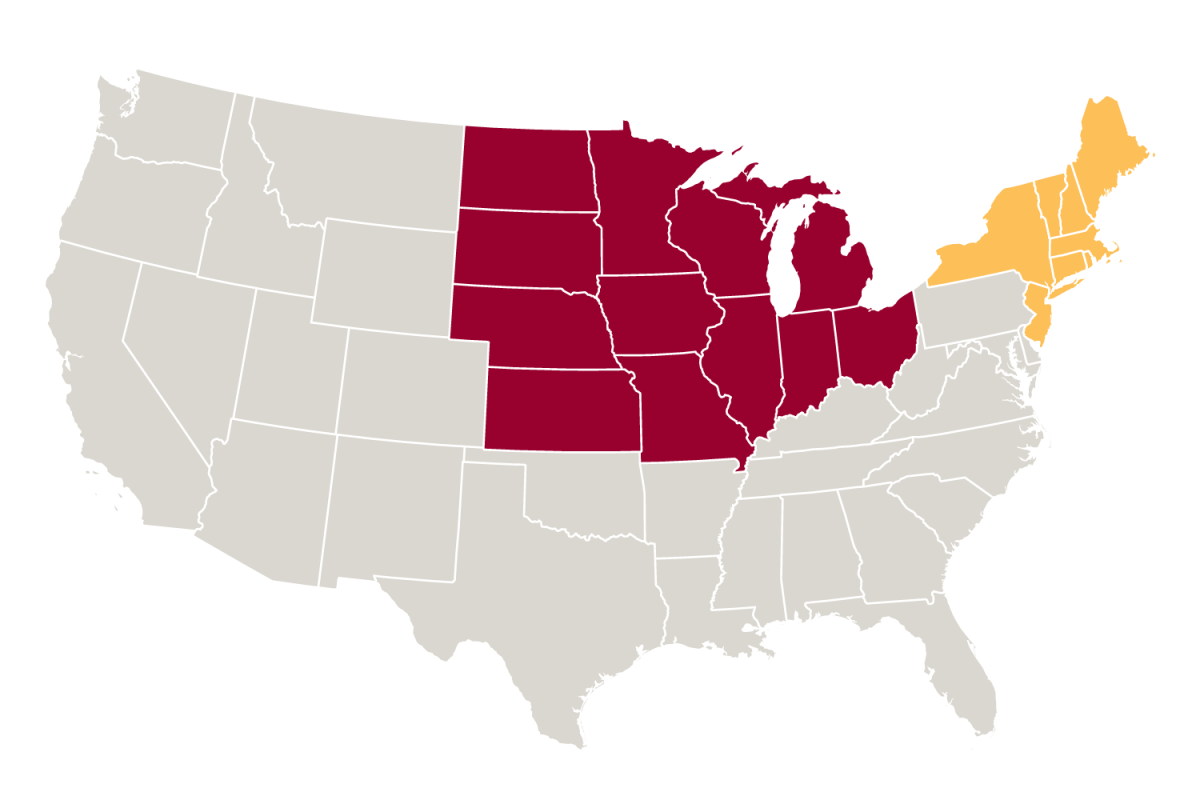
Where students accepted jobs

| Region | Percent |
|---|---|
| Midwest | 89% |
| Northeast | 11% |
Sources of Accepted Jobs
Explore the diverse sources through which Master of Accountancy graduates secured their jobs, highlighting key channels and recruitment strategies.
